Growth is now the return
For most of the last decade, private equity could lean on the market to lift exit values. Low interest rates pushed multiples steadily higher, and Bain estimates that rising multiples powered more than half of all buyout returns in that period (Bain, 2026). Its earlier study of 65 mature post-crisis buyouts reached the same conclusion: about half of value creation came from multiple expansion, and margin improvement contributed much less (Bain, 2019). Cheap debt did the rest. In a typical 2015 buyout, half the purchase price was borrowed at 6–7%. A deal needed only about 5% annual EBITDA growth to return 2.5x over five years, roughly a 20% IRR.
That arithmetic no longer works. Borrowing costs are now 8–9%, and leverage is closer to 30–40% of the purchase price. Entry multiples reached a record 11.8x EBITDA in 2025, against a 2010–2022 average of 9.1x (McKinsey, 2026). Further expansion looks unlikely: 80% of GPs expect multiples to stay flat. Bain sums up the new arithmetic as "12 is the new 5". The same 2.5x now needs roughly 10–12% annual EBITDA growth.
With financial engineering and multiple expansion contributing less and less, returns now depend on the performance of the business. That return to fundamentals should be welcome. It gives great investors a chance to shine, because performance now depends on the revenue growth and margin expansion you underwrite, and on how well you understood them before you signed.
Underwrite the base case, keep the value creation plan as upside
With leverage and multiples doing less, the value creation plan matters more than ever. Pricing, procurement, operational improvement and bolt-ons are how good sponsors earn their returns. The harder question is how much of that plan to pay for at entry.
The record argues for caution. In the same Bain study, 71% of deals fell short of their projected margins, by an average of 330 basis points. In that era, rising multiples covered the shortfall; today they would not. Bain traced part of the problem back to diligence: strategy, commercial and cost work done in silos, so no one saw how the levers interacted.
The discipline that follows is to underwrite the business as it is and treat the value creation plan as upside. The price should rest on drivers the business has already shown it can deliver. Initiatives still to be executed carry real uncertainty, and they earn a place in the base case only once the evidence supports them.
Look at where returns came from and the direction is clear. StepStone's analysis of buyouts made between 2010 and 2022 attributes 59% of returns to leverage and multiple expansion, and 41% to revenue growth and margin improvement (cited in McKinsey, 2026). Debt now funds 37% of entry multiples, against a 2010–2022 average of 44%, and multiples are expected to stay flat. The first two sources are shrinking, and planned margin gains carry the most execution risk. That puts the existing revenue engine at the centre of the base case, and it deserves the closest scrutiny in diligence. Understanding it well also gives the value creation plan a sound baseline to build from.
A concentrated portfolio leaves no room for error
A typical buyout fund holds 10 to 20 companies (Borysoff & Brown, 2024). One weak deal is 5% to 10% of the fund, and a single write-off can cost a manager its next fundraise.
Warren Buffett told his 1996 shareholder meeting that diversification is protection against ignorance, and makes little sense if you know what you are doing. A concentrated PE portfolio has already given up that protection. The only substitute is knowing what you are buying. Diligence is the best risk management tool a PE investor has. Revenue diligence matters most, because revenue is now where the return comes from.
What most deal teams look at
In practice, revenue diligence is still too thin. It often stops at:
- a revenue CAGR, perhaps split by segment;
- the top 10 customers by year, or the top 20 if you are lucky;
- some monthly trend analysis.
In today's market that is wholly inadequate. A CAGR tells you how fast the business grew. It does not tell you where the growth came from, whether it will repeat, or what it cost to win. A top-10 list covers the customers least likely to reveal a problem: concentration risk sits there, while churn usually sits in the long tail.
Build a revenue cube for every deal
Revenue diligence should do two things: explain where historical growth came from, and test the growth assumed in the model. Neither is possible without a revenue cube.
At a minimum, the cube is revenue by customer, by product, by month. Add entity, region, channel or salesperson where the business is run along those lines. Build it from the transaction or billing data in the data room. Reconcile it to the management accounts and the audited revenue before anyone draws a conclusion from it.
For recurring and repeat-revenue businesses this should be table stakes. Once the cube exists, every revenue question the investment committee asks can be answered from one source.
The revenue bridge
The cube's first output is the revenue bridge, sometimes called the snowball. It explains the movement from one period's revenue to the next:
Opening revenue
+ New customers: revenue from customers with no revenue in the prior period
+ Upsell: more of the same products to existing customers, through volume or price
+ Cross-sell: products an existing customer has not bought before
− Downsell: lower spend from customers who stay
− Churn: revenue lost from customers who leave
= Closing revenue
From the bridge come the KPIs that belong in every IC paper for a recurring or repeat-revenue business:
| KPI | Definition | What it tells you |
|---|---|---|
| Gross revenue retention (GRR) | (Opening − downsell − churn) ÷ opening | How much of the base survives with no selling effort |
| Net revenue retention (NRR) | (Opening − downsell − churn + upsell + cross-sell) ÷ opening | Whether the installed base grows by itself |
| Logo churn | Customers lost ÷ opening customers | Breadth of attrition; differs from revenue churn when small customers leave |
| New customer revenue | Revenue from new customers ÷ opening revenue | Go-to-market output |
| Attach rate | Average number of products per active customer | Cross-sell ability |
| Price vs volume | Upsell split into price and quantity, where quantities exist | Whether growth is earned or charged |
Same growth, different businesses
Consider two businesses that both grow 10%:
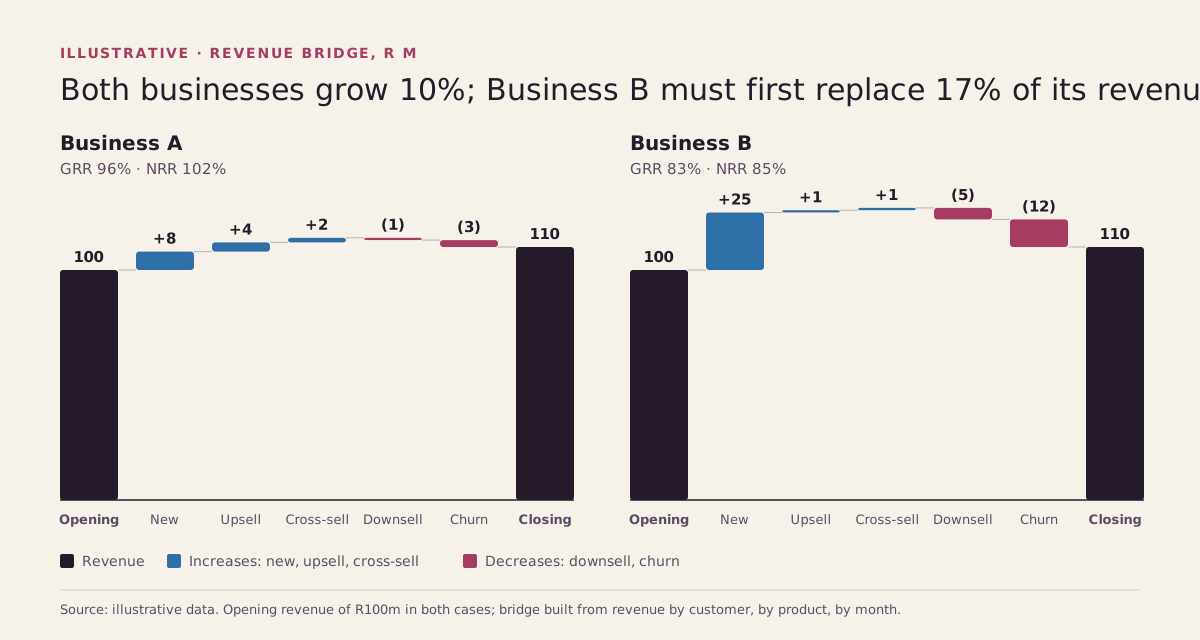
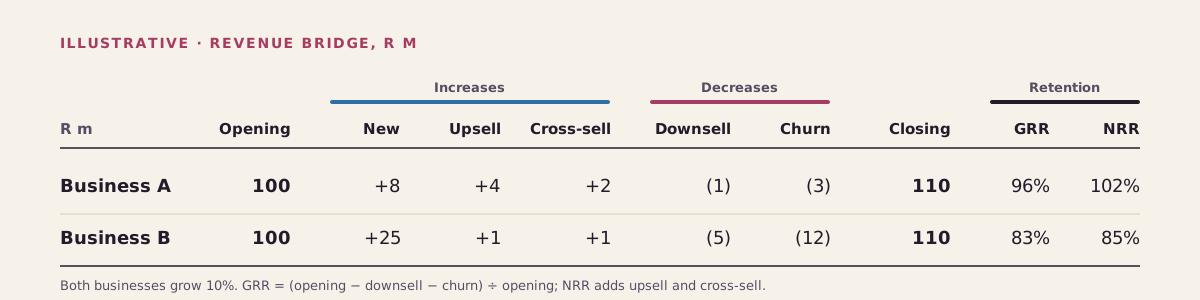
Business A grows from its installed base. Customers stay, buy more and take up new products. Its growth is cheap to sustain and likely to repeat.
Business B loses 17% of its revenue each year and has to win that back before it grows at all. Its growth depends on a sales engine running at full speed indefinitely, and any slowdown in new wins shows up immediately as decline.
On a revenue CAGR these are the same business, but the market does not price them the same. Among public SaaS companies, the median business with NRR above 120% traded at 9.3x revenue, against 3.1x for those below 100% (Software Equity Group, 2024). Your target is probably not a SaaS business, but the logic carries over: revenue you keep is worth more than revenue you have to win again.
What the bridge lets you ask
Go-to-market. New customer revenue, set against sales headcount and spend, shows how efficiently the business wins. Ask management why new wins rose or fell in particular years, and which channels and salespeople produced them.
Product-market fit. Run retention by product. A product with strong NRR has found its market. A product with high churn is being sold to customers who do not keep it, however good its top line looks.
The forecast. Every growth line in management's forecast maps to a component of the bridge. For each one, establish what is driving it:
- new customer wins;
- upselling existing customers, and whether through volume or price;
- cross-selling new products;
- reducing customer losses.
The thesis. These KPIs let you test the investment thesis directly. Many theses rely on selling more products to the same customers: a platform-and-bolt-on strategy, a product launch, a "land and expand" story. Attach rates show whether the business has ever done this. In the best businesses, products per customer rise year after year. If the attach rate has been flat for five years, the cross-sell synergy in the model is a hope rather than a plan.
Cohorts show how durable the relationships are
Group customers by the year they were won, treat customers won before the review period as an opening cohort, and track each group's monthly revenue indexed to 100 in its first month:
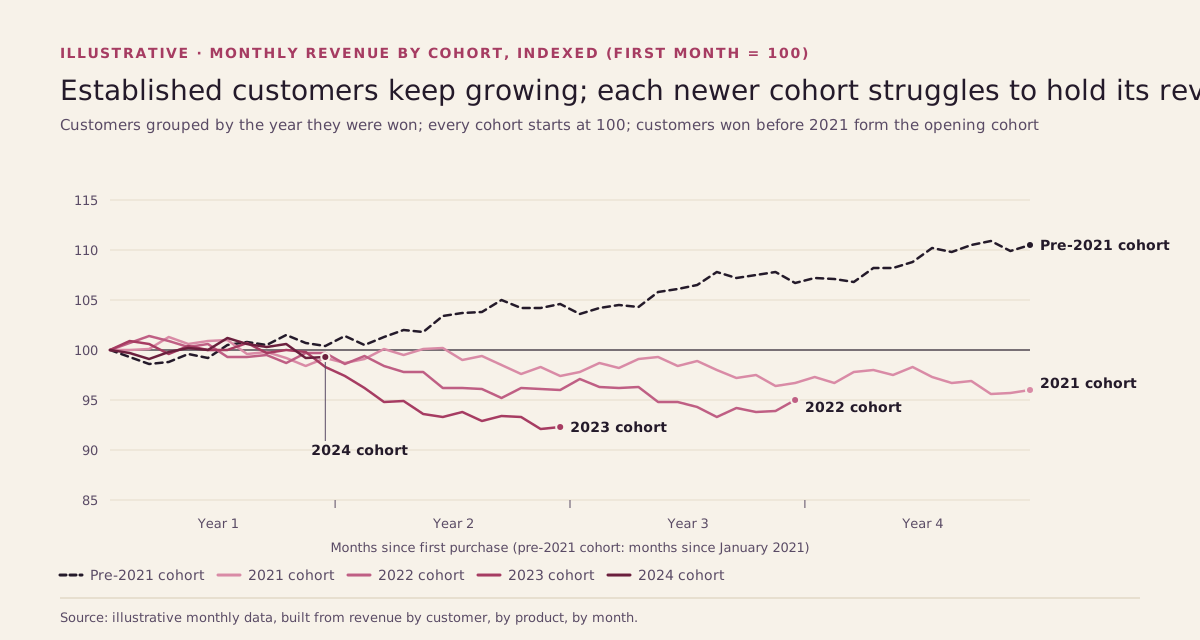
The pattern here is common in PE targets. Most are long-established businesses, and the opening cohort, the customers won before the review period, is usually the strongest: loyal, growing and carrying most of the revenue. The test is whether newer customers behave the same way. In this example they do not. Each cohort since 2021 has lost revenue after its first year, and the most recent ones are falling faster.
That matters more than the headline suggests. Total revenue can look healthy for years because the established base is still growing. But that base will not grow forever, and the future of the business sits in the newer cohorts. If they hold less revenue than the customers they are meant to replace, the business may be winning weaker customers, discounting to win, or losing its edge with new buyers. The growth in the model needs to say which.
Businesses without recurring revenue
The usual objection is that this only works for recurring revenue businesses. It does not. Recurring revenue is where the bridge is simplest and cleanest, but any business with identifiable customers can produce one. Outside recurring revenue it takes more work, mostly in deciding what counts as a customer period.
Most businesses sell similar quantities to the same customers on a regular cycle. A distributor's customer may order monthly; an industrial customer may buy annually. The work is to find that cycle in the data:
- Measure how often each customer buys, from the gaps between orders.
- Choose a comparison period that matches the cycle, such as a rolling 12 months against the prior 12.
- Set a churn rule, for example that a customer with no revenue for 12 months is lost.
- Classify every customer period as new, retained or lost, and split retained revenue into upsell, downsell and cross-sell by product.
- Where quantities exist, split the change into price and volume.
These definitions involve judgement, so write them down and present them alongside the numbers. The IC should see the rules as well as the chart. Once the rules are set, the same bridge, KPIs and cohorts follow, and so do the same insights.
Messy data is a finding in its own right. Customer names that do not match across systems, revenue that cannot be traced to a customer, and billing that does not tie to the ledger all tell you how well the business knows its customers.
Use the historical bridge to stress-test the forecast
Build the forecast in whatever way suits the business: bottom-up from the pipeline, top-down from market share, or price times volume. Then translate it into bridge terms. Every forecast implies a level of new customer revenue, retention and expansion each year, whether or not the model shows them.
Set those implied figures against the historical bridge. The history acts as a mirror, and the gaps between the two are where the IC discussion should focus:
- Retention. Does the forecast assume GRR or NRR better than anything the business has achieved?
- New customers. Does new customer revenue exceed the best year on record, and is the sales capacity there to deliver it?
- Expansion. Is upsell driven by price beyond what customers have accepted before? Is the cross-sell rate higher than the attach rate history supports?
- Concentration of the ask. Does most of the forecast growth come from one source? A plan that needs churn to halve, or new wins to double, should say why.
Take a business forecast to grow 15% a year that has historically retained 100% of its revenue, with expansion offsetting losses. Unless retention improves, all 15% must come from new customers. If new customer revenue has historically added 6–8% a year, the forecast needs the sales engine to double its output. That may be possible, but it is an assumption to underwrite, not a number to accept.
The bridge also gives you a better downside case. Rerun the forecast with each component at its historical average, then at its worst year. The result is a downside grounded in what the business has actually done, rather than an arbitrary haircut to revenue.
The cube outlives the deal
The cube built in diligence becomes the monthly KPI pack after close. It is also the baseline for the value creation plan and the exit data book. Any serious buyer will rebuild it at exit. A seller who has tracked these KPIs for five years can explain the growth in its own terms.
Three questions for your next IC paper
- Which sources of growth (new customers, expansion, better retention) does next year's forecast rely on, and in what proportions?
- Has the business ever delivered that mix?
- Are the newest customer cohorts behaving like the oldest?
If the paper cannot answer them, the revenue diligence is not finished.